


Econ Intel Brief - April 4, 2025
On Today's Jobs Report, and the Largest Tax Hike in U.S. History

All,
In today’s EIB, please find…
Key Takeaways on Today’s Jobs Report
Highlights for Media Hits
Overview of “Liberation Day” Tariffs
“Liberation Day” is the Largest Tax Hike in U.S. History
RecessionWatch Update
Preview of Upcoming Data Releases
Have questions or suggestions? Looking for an experienced witness to testify? Want an in-person briefing? Email chris@russoecon.com or call/text (908) 947-5166.
Feel free to forward. Subscribing is free. You can unsubscribe at any time.
Best,
Chris
Key Takeaways on Today’s Jobs Report
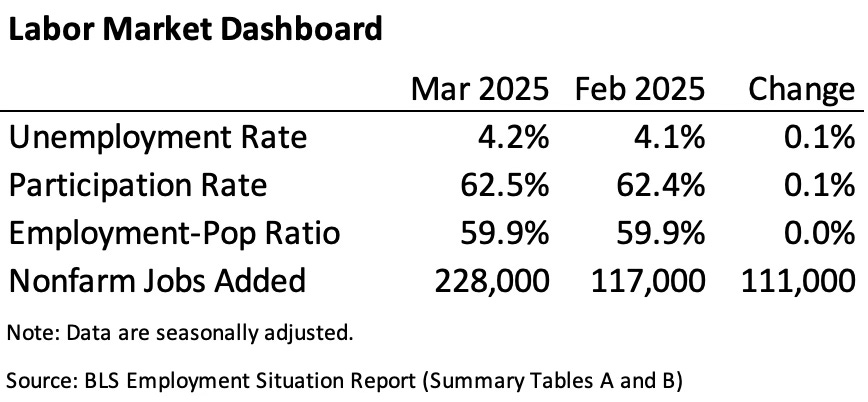
At 8:30am ET, the BLS announced that in Mar 2025:
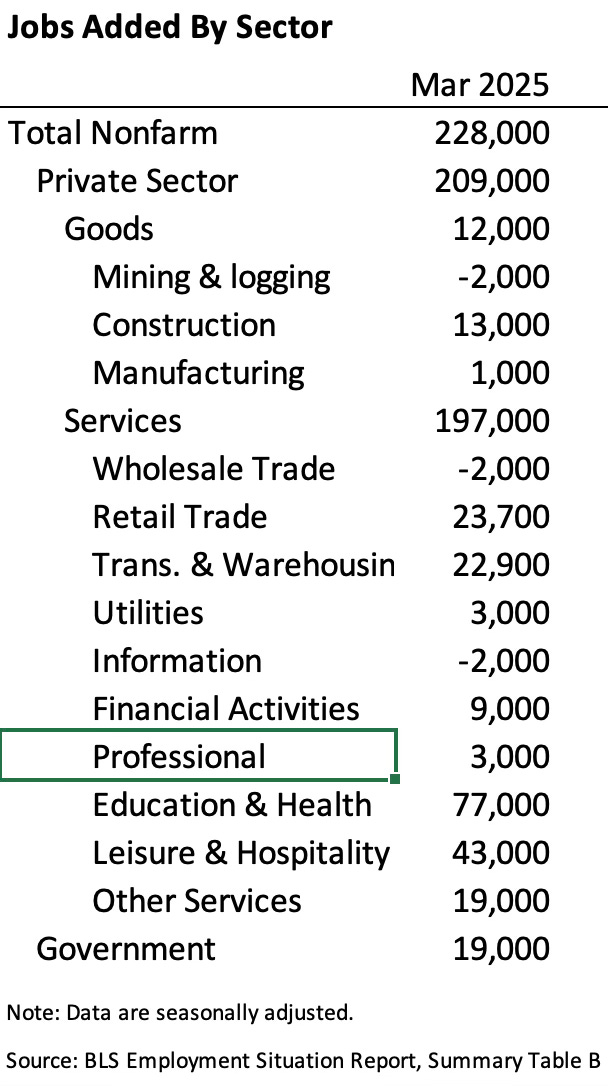
The U.S. economy added 228,000 non-farm jobs.
209,000 jobs were added to the private sector with the bulk in services.
Notable sectors include healthcare and social assistance (77,800 jobs added), leisure and hospitality (43,000 jobs added), and government (19,000 jobs added).
However, employment figures for Jan and Feb were revised down. Combined, the U.S. added 48,000 fewer jobs in those months than previously estimated.
The headline unemployment rate was 4.2%, little changed from last month.
The labor force participation rate was 62.5%, also little changed from last month.
However, as of writing, global markets are selling off as participants digest yesterday’s tariff news. The on-the-run 10-year Treasury yield is trading below 4%. Crude oil is trading below $63 a barrel. While U.S. equity markets are not yet open, stock futures are trading down several percent. European stocks are also down around 4%.
Highlights for Media Hits
This is a fine print for messaging, but be prepared to talk about tariffs and deteriorating U.S. stock prices. During Pres. Trump’s second full month back in office:
The U.S. economy added 228,000 jobs, soundly beating expectations of 130,000.
For comparison, Pres. Biden added only 111,000 in his last month in office.
Indicates that the media’s fears of a recession have been misplaced (so far) .
209,000 of the jobs added (or about 95%) were in the private sector.
Construction employment increased by 13,000.
Manufacturing employment increased by 1,000.
Average hourly wages and average weekly wages continued growing at a steady pace, and likely outpaced inflation. (Wages are rising faster than prices.)
Overview of “Liberation Day” Tariffs
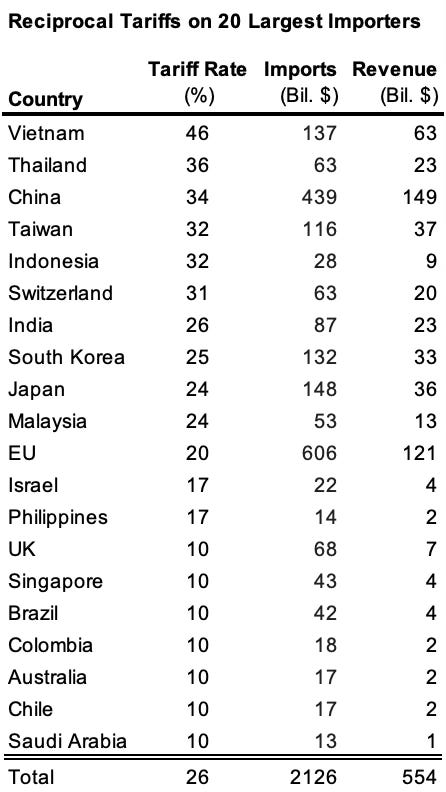
On Apr 2, Pres. Trump announced the following tariffs, which were harsher than expected.
Minimum 10% tariff on all imports to the U.S.
“Reciprocal” tariffs on about 60 other nations.1
Among our largest trading partners, Asian countries are the hardest hit. E.g., Vietnam (46%), Thailand (36%), China (34%), and Taiwan (32%).
For now, Canada and Mexico are exempt from these tariffs under the USMCA.
Tariffs add onto existing duties (but exclude steel and aluminum imports). E.g., combined with the prior 20% tariff, the U.S. tariff on China is now 54%.
Tariffs have even been levied on countries with whom we have a trade surplus (e.g., Australia, UK, and Brazil).
Duties on small-value imports (previously exempt under de minimis exception).
Applies to China and Hong Kong. Will apply to other nations as systems allow.
Imports through the mail are taxed at 30% or $25 per item ($50 after June 1).
Imports through other means are taxed at the otherwise applicable rate.
Separately, the U.S. has already imposed a 25% tariff on all automobile imports (except imports from Canada and Mexico qualifying under USMCA).
“Liberation Day” is the Largest Tax Hike in U.S. History
JP Morgan estimates a new average effective tariff rate of 27%, up from 2.3% last year. By my math, this is the largest tax hike in U.S. history even after adjusting for inflation.
Trade advisor Peter Navarro has projected $700 billion per year in revenue from tariffs ($600 billion from reciprocal tariffs and $100 billion from auto tariffs).
The Revenue Act of 1942 hiked taxes to fight WWII. It was scored as raising $10 billion per year.2 That is $192 billion per year on an inflation-adjusted basis.3
That said, the tariffs will likely raise much less than the touted $700 billion per year.
Reverse engineering Mr. Navarro’s calculations, he assumes that imports will not fall. This is not realistic. When you tax something, you tend to get less of it.
This figure also does not account for increased input costs reducing U.S. GDP, which will reduce tax revenue from (e.g.) individual and corporate income taxes.
RecessionWatch
I still do not think that the U.S. economy is in a recession.4
Key recession indicators are healthy.
The New York Fed model estimates that GDP growth was 2.86% in Q1 (SAAR).
However, there are some blemishes.
The Atlanta Fed GDPNow model forecasts that the economy contracted by 2.8% in Q1 (SAAR).7
The S&P 500 is down by about 11% since Pres. Trump took office. There was a large drop on tariff news. The stock market is now in “corrections” territory.8
And U.S. economic outlook remains foggy. Potential tailwinds for growth include:
Smart deregulation. E.g., the EPA’s reconsideration of the 2009 finding that carbon emissions endanger public health (justification for carbon regulation).
Pro-growth tax reform (e.g., bonus depreciation, EBITA, R&D tax treatment).
A trade détente (e.g., entering a free trade agreement with the United Kingdom).9
While potential headwinds for growth include:
Tariffs, esp. if our major trading partners retaliate with even higher trade barriers.
“No-growth” tax cuts that increase the deficit and crowd out capital investment.
Supply-chain disruption from geopolitical conflict (e.g., the Russia-Ukraine war, the invasion of Taiwan, shipping delays in the South China Sea or Red Sea).
Treasury market illiquidity. (E.g., if tariffs reduce foreign demand for U.S. Treasuries, then how well will domestic markets absorb a greater issuance share?)
Preview of Upcoming Data Releases
The next Econ Intel Brief will cover the CPI inflation release on 4/10 at 8:30am ET.
The Cleveland Fed model, which incorporates real-time data on energy prices, forecasts a month-over-month CPI inflation rate of 0.03%. This would lower the year-over-year inflation rate to 2.49%, which is still above the Federal Reserve’s 2% annual target.
Owing to recession fears, options markets are pricing a 58% chance that the Federal Reserve will hold interest rates steady at its next monetary policy meeting (May 6-7). Markets are pricing a 42% chance of a 0.25% cut. The current target range for overnight rates is 4.25% to 4.50%.
Fed Chairman Powell is speaking later today on the U.S. economic outlook. Watch for his comments on tariffs. Federal Reserve officials have recently taken a hawkish tone, with several officials suggesting that tariffs could push up inflation in the near term.
BEA will release its “advance” estimate for Q1 real GDP growth on 4/30 at 8:30am ET.
Calling these tariffs “reciprocal” is a misnomer. The U.S. is not levying tariffs on other countries equal to the tariffs they have levied on the U.S. Rather, the administration has attempted to estimated the level of tariffs necessary to balance trade between countries.
The U.S. Trade Representative website explains the underlying calculation. I am not a trade expert, but I think that these calculations have a number of problems. Alan Cole at the Tax Foundation discusses some of the issues in a recent note.
The bottom line: The tariffs should be about 1/4 the size calculated by USTR because the administration assumed too small of a passthrough from tariffs to import prices; and the assumptions underlying the calculation only make sense if you are trying to close your trade deficit with a single small country (not your bilateral trade deficits the rest of the world).
I also worry that the results of these calculations may have been applied incorrectly. The admin interprets the result as an absolute change in the level of tariffs. That is, if the result is 50%, then it interprets this as justifying a 50% reciprocal tariff on top of any existing tariffs. In the economic models I am familiar with, this should instead be interpreted as a relative change in the tariff rate. That is, if the existing tariff rate is 10%, then a result of 50% justifies a 5% reciprocal tariff (i.e., one half of the existing 10% tariff).
Jerry Templaski, “Revenue Effects of Major Tax Bills,” U.S. Treasury Department, OTA Paper 81, September 2006, https://home.treasury.gov/system/files/131/WP-81.pdf.
Calculated using the Consumer Price Index for all Urban Consumers.
Average CPI in 1942 = 16.33
Average CPI in 2024 = 313.689
Inflation-adjusted score of Revenue Act = (313.689/16.33) * $10 billion = $192 billion
For various methodological reasons, the CPI likely overstates inflation from 1942 to the present. Therefore, the actual inflation-adjusted value is likely significantly less.
A recession is defined as a broad decline in economic activity. It is the downturn of the business cycle. Recessions in the U.S. are dated by the NBER’s Business Cycle Dating Committee. While not recognized as “official” by any U.S. statute, these dates are widely accepted among professional economists. However, the NBER only announces recessions in retrospect. Economists attempt to identify recessions in real-time using economic data.
Economists sometimes rules of thumb for identifying a recession. “Two consecutive quarters of negative GDP growth” is one rule of thumb (often mistakenly said to be the “definition” of a recession). A large increase in the unemployment rate (e.g., 0.5% over three months) is another rule of thumb. However, these rules of thumb are not perfect.
A positive value indicates that the U.S. economy is growing at a faster-than-average rate.
Consumer confidence has not been a useful predictor of consumer spending in recent years. Consumer credit grew at a modest pace in Jan (the latest month we have data on).
This pessimistic forecast is primarily driven by an mis-measurement of imports. As I understand it, there was a large inflow of monetary gold into the U.S. from London in Q1 due to a difference in gold prices. While monetary gold does not count as an “import” in the GDP calculation, the real-time import data underlying the Atlanta Fed’s GDPNow model does not disaggregate monetary and non-monetary gold. Therefore, the model sees a large spike in imports and predicts commensurately lower real GDP growth. When the Atlanta Fed attempts to adjust for this mis-measurement, the model instead predicts a more modest contraction (0.8%).
A “correction” is typically defined as a decline between 10% and 20%. A “bear market” is typically defined as a decline greater than 20%.
While an overall reduction of trade barriers from this exercise seems highly unlikely to me, there are glimmers of hope. Ahead of the admin’s tariff announcement, Israel removed its remaining trade barriers with the U.S. (These trade barriers were small. Israel was the first country with whom the U.S. entered a FTA.) The U.S. should expeditiously work on a FTA with the UK, and work on jointly reducing barriers with our other allies and partners.