


Econ Intel Brief - April 14, 2025
Despite claims to the contrary, worker's earnings have caught up with inflation.

All,
In today’s bonus EIB, I tackle a claim by former BLS Commissioner Bill Beach that workers’ weekly earnings have not kept up with inflation since the pandemic.
With the greatest respect for Bill, I disagree. On average, inflation-adjusted earnings are higher today than they were pre-pandemic. Workers are no longer playing catch up with inflation. This is a benefit of competitive labor markets: ultimately, workers are paid the economic value that they add. Conservatives should be touting this win.
The next scheduled EIB will be on Wednesday morning. The Federal Reserve will release industrial production data for March, which is a key recession indicator.
Best,
Chris
Three Points of Disagreement
Bill calculates the total percentage change in the consumer price index (CPI) and average weekly earnings (AWE) between June 2020 and March 2025. According to Bill, the CPI has increased by 21.85%, while AWE have only increased by 19.22%. That is, total CPI inflation was 2.63 percentage points higher than total AWE growth.
I disagree with Bill on three main points.
Bill miscalculates the total percentage change in the CPI and AWE.
Growth in AWE likely understates the true growth in earnings.
Growth in the CPI likely overstates the true rate of inflation.
Adjusting for these factors, I calculate that AWE outpaced CPI inflation by 2.35% (low estimate) to 7.40% (high estimate) over the last five years. Earnings rose faster than prices.
These numbers offer a radically different view of the labor market. Bill suggests that “the average worker’s struggle to regain purchasing power is ongoing and unrelenting.” On my view, although workers were badly set back by the pandemic and by a 40-year high inflation rate, their earnings are better today than five years ago.
Bill Miscalculates the Total Percentage Change in the CPI and AWE
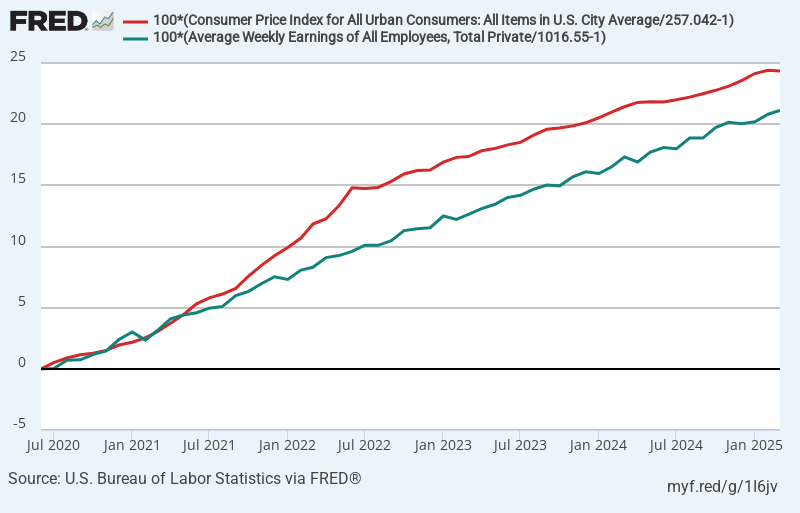
Suppose you want to measure the total CPI inflation rate between June 2020 and March 2025. This is calculated by dividing the index for March 2025 (319.615) by the index for June 2020 (257.042), subtracting 1, and multiplying by 100.1
Similarly, the total percentage change of AWE between June 2020 ($1016.55) and March 2025 ($1231.20) is calculated as follows.
However, these figures do not match Bill’s numbers. Reverse engineering Bill’s calculations, he seems to have added together the monthly growth rates. This is a mistake because adding together the monthly rates ignores compounding.
By analogy, suppose you invest in a money market account paying 0.2% per month for 100 months. The total return on your investment (including compounding) is 22.12% not 20%. Just adding the monthly rates will ignore 2.12% worth of compounded gains.
I have re-created Bill’s original graph (with corrected calculations) using FRED. Interestingly, the correction bolsters Bill’s case. The measured gap between CPI inflation and AWE growth is now 3.23%, somewhat larger than originally calculated.
Growth in AWE Likely Understates the Truth Growth in Earnings
However, millions of workers lost their jobs by June 2020, with disproportionate job loss for lower-wage workers. These workers were neither deemed “critical,” nor could they work from home. (E.g., retail workers, leisure and hospitality workers, etc.) Because AWE does not adjust for the composition of the labor force, these dynamics can give a misleading impression of how well workers are keeping up with inflation.
On net, these job losses dramatically increased average earnings by dropping low-wage workers from the average. Conversely, the disproportionate re-employment of these workers over the next few years slowed the growth rate of average earnings. But this risks giving a distorted picture. Lower-wage workers re-entering employment does not necessarily mean that existing workers were not keeping up with inflation.
If you still want to look at AWE, then a better approach would be to measure from December 2019 (i.e., before any distortions to the composition of the labor market). Adjusted for CPI inflation, AWE are 2.35% higher in March 2025 than December 2019.
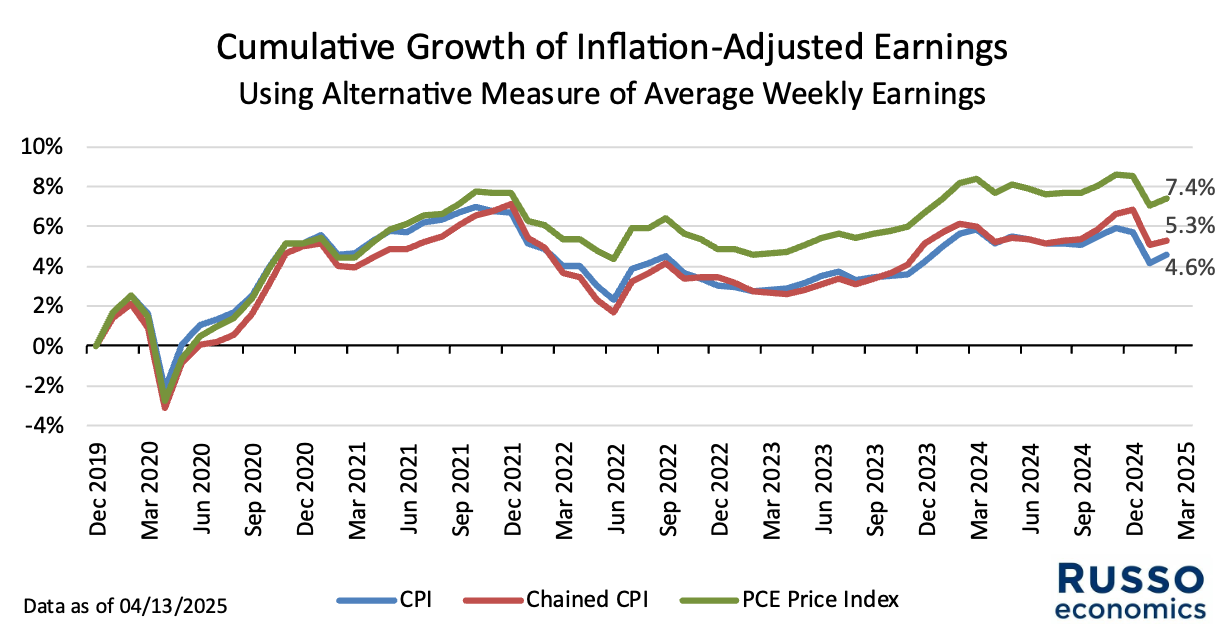
Alternatively, we can divide the total disbursements of wages and salaries per week by the number of people in the labor force. Essentially, this is an average weekly earnings statistic that treats unemployed workers as having earnings of $0. Adjusted for CPI inflation, this alternative measure of AWE is 4.60% higher in February 2025 than December 2019.2
Growth in the CPI Likely Overstates the True Inflation Rate
Additionally, purchasing patterns dramatically changed during the pandemic. In part, these changes reflect consumers substituting away from goods and services that became relatively more expensive. As consumers substitute out of certain categories (e.g., domestically-produced services) into other categories (e.g., imported durable goods) this should affect the “weight” that a price index gives to each category.
However, the CPI does not immediately capture changes in consumer purchasing patterns. The weights in the CPI are based on an annual survey of consumer expenditures, the results of which are incorporated into the CPI with a lag. As a result, CPI inflation will tend to understate this “substitution effect,” and will therefore tend to overstate the “true” (hypothetical) rate of consumer price inflation.3
The “chained” CPI produced by the BLS is an alternative measure of inflation that attempts to better account for the substitution. Using the chained CPI, our alternative measure of AWE is 5.3% higher in February 2025 than December 2019.
Alternatively, we can use the Personal Consumption Expenditures (PCE) price index, which is the Federal Reserve’s preferred measure of inflation. (Its 2% annual inflation target is stated in terms of the annual percentage change in the PCE price index.) Using the PCE price index, our alternative measure of AWE is 7.40% higher in February 2025 than December 2019.
While none of these statistics are perfect, either, we can have confidence that wages and salaries are no longer playing catch up with inflation.
Following Bill’s calculations, I am using the seasonally adjusted data for both the CPI and AWE. Since we are measuring the percentage change over about five years, the impact of the seasonal adjustment factors on the final results should be small.
Data for March 2025 are not yet available. This will be released at the end of the month with the BEA’s “advance” estimate of Q1 GDP.
As Harvard economist Alberto Cavallo points out, this cuts both ways during the pandemic. With social distancing and other restrictions, the ability for consumers to substitute in response to relative prices was curtailed.