EIB #16 - Are The Rates Too Damn High?
The Fed keeps rates steady despite Pres. Trump's call for a 2.5 percentage point cut and VP Vance's accusation of "monetary malpractice."
All,
In today’s EIB, please find:
Key Takeaways from Today’s Federal Reserve Announcement
Target range held steady at 4.25% to 4.50%, as widely expected.
Chairman Powell’s press conference starts now (2:30pm ET).
Current interest rates are within their historical norms.
Overnight rates are (arguably) consistent with rules-based policy.
The money supply is expanding at a solid pace.
Feel free to forward or subscribe (it’s free). Thanks for your support!
Best,
Chris
Key Takeaways from Today’s Federal Reserve Announcement
At 2:00pm, the Federal Open Market Committee (FOMC) announced that it:
Held the target range for overnight rates at 4.25% to 4.50%, as widely expected.
The current effective federal funds rate (EFFR) is 4.33%, within the range.
Will continue reducing its holdings of Treasuries, agencies, and agency MBS.1
The Fed sees economic activity as expanding at a solid pace, pointing to a low unemployment rate and other solid labor market indicators. I am a bit less sanguine. I am concerned by downwards revisions to payrolls data, the huge drop in employment reported by households, and a 1% drop in advance real retail and food services sales.
The Federal Reserve released an updated Summary of Economic Projections (SEP). Compared to the prior SEP, the median FOMC participant sees the following for 2025.
A lower real GDP growth rate (1.4% v. 1.7%)2
A higher unemployment rate (4.5% v. 4.4%)
A higher PCE inflation rate (3.0% v. 2.7%)
The dot plot implies two cuts this year (unchanged) and one cut next year (down from two cuts). However, seven FOMC participants think no cuts would be appropriate in 2025. Based on the median participant’s view that the economy is strong and inflation is re-accelerating, keeping rates high (or even hiking rates) would be appropriate.
Options markets are currently pricing 2 rate cuts this year and 3 next year.3 As this move was widely anticipated, U.S. stocks and bonds were little changed on the news.
Pres. Trump Calls for a Huge Interest Rate Cut
It is no secret that Pres. Trump wants the Fed to slash interest rates, today calling for a 2.5 percentage point cut. VP Vance shares this view, recently posting on X that “the refusal by the Fed to cut interest rates is monetary malpractice.” Are they right?
As discussed below, current interest rates are within their historical norms, and are arguably consistent with rules-based monetary policy. The broad money supply is also expanding at a solid pace. B/c the U.S. economic outlook is highly uncertain, I think that holding rates steady while waiting for a clearer economic picture is sensible.
Moreover, the admin seems to view the Fed’s rate decisions through the lens of debt financing. Pres. Trump says he wants lower rates so Treasury can borrow long-term at cheap cost. This is not a new idea. The Fed was forced to keep rates low during the 1940’s to help Treasury manage the dramatic borrowing required to finance WWII.
The Fed kept rates low by monetizing Treasury debt. The result was high and volatile inflation, which reached 9.4% y/y in Feb 1951. (The mechanics are somewhat different today, but the effects would be the same.) The end of this perverse arrangement gave us central bank independence: by and large, the Fed uses monetary policy to stabilize inflation and employment, while Treasury focuses on financing the national debt.
During the Biden admin, I strongly advocated for Treasury to lock-in low rates by borrowing long. This would have increased the amount of time Congress had to get our fiscal house in order. Unfortunately, the Biden admin did not listen, and the horse has since left the barn. Over time, I expect borrowing costs to continue to increase in tandem with the deficit. The Trump admin should focus on getting the deficit down.
Are Interest Rates Too High?
As alluded to above, there are at least three ways to look at this question.
1. Historical Comparisons
While rates vary over time, the EFFR is currently within historical norms. It is higher than in the 2010’s because inflation was below-target then, but is above-target now.
It is difficult to take a longer-term view because expected inflation was substantially higher in the decades before 1990. A quick but unscientific approach is to “adjust” for higher expected inflation by subtracting the 12-month inflation rate from the EFFR.
If anything, what sticks out as abnormal is the Fed’s sluggishness of raising rates in 2021-2022 as inflation surged to a four-decade high. (See the large downward spike.)
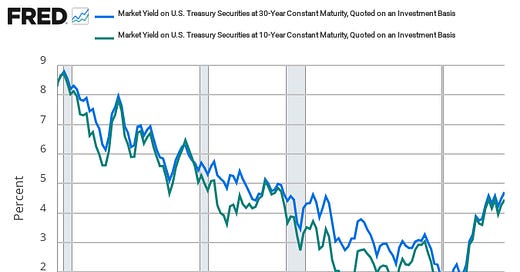
Similarly, long-term Treasury yields are trading around levels seen during the 2000’s. While their downward trend may have reversed, these rates are not abnormally high.
Historical comparisons are not dispositive. Interest rates could be within historical norms, but the Fed still might be wrong not to lower (or raise) rates. That depends on current economic data, and our best guess at where the U.S. economy is headed.
2. Simple Monetary Policy Rules
Simple monetary policy rules (a/k/a Taylor rules) are mathematical formulae that prescribe an interest rate based on economic data. In general, they take the form:4
On the left-hand side, i is the prescribed interest rate (i.e., what the EFFR should be according to the rule). On the right-hand side, we have seven different variables.
r* is the “natural” rate of interest.
π is the inflation rate.
π* is the inflation target.
y is a measure of economic output or employment.
y* is a measure of potential economic output or potential employment.
α measures how strongly the Fed reacts to inflation above or below target.
β measures how strongly the Fed reacts to output above or below potential.
The point you should take away from this formula is the sheer number of assumptions that are required to specify even a “simple” monetary policy rule.
What is your estimate for the natural rate of interest?
How are you measuring the inflation rate? (E.g., CPI? PCE? Headline? Core?)
What is your inflation target? (The Fed’s inflation target is 2% per year.)
How are you measuring output/employment? (E.g., GDP? Unemployment rate?)
How are you estimating potential output or potential employment?
How strongly should the Fed react to inflation above/below target?
How strongly should the Fed react to output/employment above/below potential?
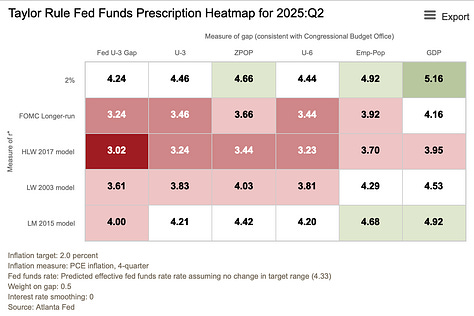
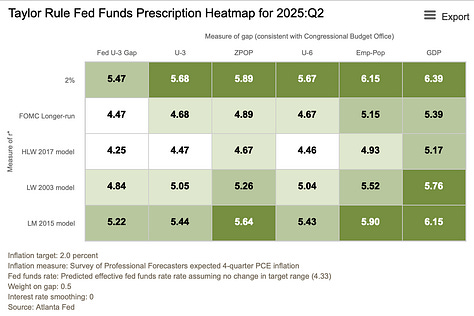
The Atlanta Fed has a utility showing how different assumptions can generate widely different prescriptions for monetary policy. Here are examples.


The first table is based on headline inflation. Since headline inflation has fallen close to 2%, these rules tend to suggest that monetary policy may be too tight.
The second table is based on “core” inflation.5 Since core inflation is still above target, these the rules give different prescriptions based on the assumed r* and y*.
The third table is based on professional forecasts of inflation. Since forecasters expect inflation to re-accelerate, these rules suggest that policy may be too loose.
Finally, what if we simply ignore the output gap and focus on inflation?6 Call this the Chairman French Hill approach. He and other Republicans on Financial Services have long argued that the Fed should just focus on taming inflation.7 Here again, the rule’s prescription will depend on the natural rate of interest and the measure of inflation.


The key takeaway from these numbers is that monetary policy rules do not provide an unambiguous answer. A rule based on headline inflation and the unemployment rate could justify a cut of 1.3 percentage points, while a rule based on forecasted inflation and the employment-to-population ratio could justify a hike of 1.8 percentage points.
As another quick but unscientific approach, we might average these different rules.
For rules that include a measure of the output gap, the average is 4.60%.
For rules that exclude a measure of the output gap, the average is 4.32%
These averages are roughly in line with the current EFFR of 4.33%.
3. Money Supply Growth
We can also look at the growth of the money supply. A well-known equation relates the growth rates of the money supply, the price level, and the size of the economy. Inflation comes from money supply growth exceeding real GDP growth (π = m – y).8
One measure of the money supply is the Divisia M4 index. In April 2025, it printed at 4.0% y/y. Based on recent figures, suppose current policy would keep money supply growth at about 3.5%. Meanwhile, the median response to the Survey of Professional Forecasters implies that real GDP growth will be 1.4% over the next four quarters.
These assumptions imply an inflation rate of 2.1% over the next four quarters, suggesting that monetary policy is actually about right. Of course, different assumptions for money growth or real GDP growth would yield different results.
Upcoming Data Releases
June 26, 8:30am ET. The BEA releases its “third” estimate for Q1 real GDP growth. The “second” estimate was -0.2%, while its “advance” estimate was -0.3% (SAAR).
July 3, 8:30am ET. The BLS releases the jobs report for June. While initial numbers have surprised to the upside, jobs added have been revised down by 189,000 since Jan.
July 15, 8:30am ET. The BLS releases the CPI report for June. The Cleveland Fed nowcast is 0.23% m/m (2.62% y/y), implying that inflation is still above target.
July 30, 8:30am ET. The BEA releases its “advance” estimate of real GDP for Q2. The Atlanta Fed’s GDPNow model estimates real GDP growth is 3.4% (SAAR).
Each month, the Desk will redeem up to $5 billion of maturing Treasuries and $35 billion of maturing MBS. Amounts above the caps will be re-invested into Treasuries at auction.
The Fed’s balance sheet is $6.7 trillion, roughly $2.6 trillion higher than pre-pandemic levels. The median respondent to the New York Fed’s June Survey of Market Expectations sees balance sheet runoff ending in January 2026.
The projected GDP growth is measured as a Q4/Q4 growth rate. The projected unemployment rate is measured as an average in Q4. The projected PCE inflation rate is measured as a Q4/Q4 growth rate. The projected EFFR is measured as the year-end value.
Measured as the mode of the options-implied probability distributions for Dec 2025 and Dec 2026.
Lawyer friends, please forgive the math.
Core inflation excludes food and energy prices, which tend to be volatile. Using core inflation may give a clearer picture of inflation’s trend and reduce interest rate volatility.
This would correspond to β = 0 in the original formula.
This is a defensible view. The Fed acknowledges that it cannot affect output or employment in the long run. It is also difficult to estimate potential output or potential employment in real time. Bad estimates of the output/employment gap can badly mislead monetary policy.
I omit the derivation, assumptions, etc. for sake of the audience.


