


EIB #11 - Inflation During the First 100 Days
Key takeaways from today's CPI report, charts comparing inflation under Biden's and Trump's first 100 days, and the bottom line on the House's fiscal math.

Final Update: JCT has fixed an error in its original score of the full W&M bill, which understated the deficit impact of the bill by about $100 billion.
CBO has also released a score for the Transportation and Infrastructure Committee’s bill, which is now estimated to save $36.6 billion vs. a floor of $10 billion. (The original numbers I was looking at had their bill fall short of the savings floor by $2 billion.)
Plaudits to Chairman Graves and Republicans on the Transportation Committee for funding ATC and the coast guard while substantially exceeding their savings floor.
I have updated the numbers in the section immediately below.
Important Update: Since publication, JCT has released a score of the full W&M bill. The full bill adds $3,721 billion to the primary deficit, below the $4,500 billion cap.
While this still a dramatic increase to the primary deficit, and I continue to oppose no-growth cuts to the tax base, the full W&M bill is significantly better than the partial bill.
Reflecting this new score, the revised numbers for the overall reconciliation bill are:
$2.6 trillion increase to the 10-year primary deficit (increase of 0.6% of GDP)
Reflects $4.1 trillion in deficits from E&C, Homeland, HASC, and Judiciary
Net of $1.6 trillion in savings from other the other House committees
Meets the instruction to find a $498 billion of savings above Cmte-level floors.
Qualitatively speaking, my conclusions remain the same. This bill will generate nowhere near the economic growth required to offset the increase to the primary deficit, will therefore accelerate the debt spiral while risking much higher inflation.
All,
In today’s EIB, please find:
Key Takeaways from Today’s Consumer Price Index (CPI) Report
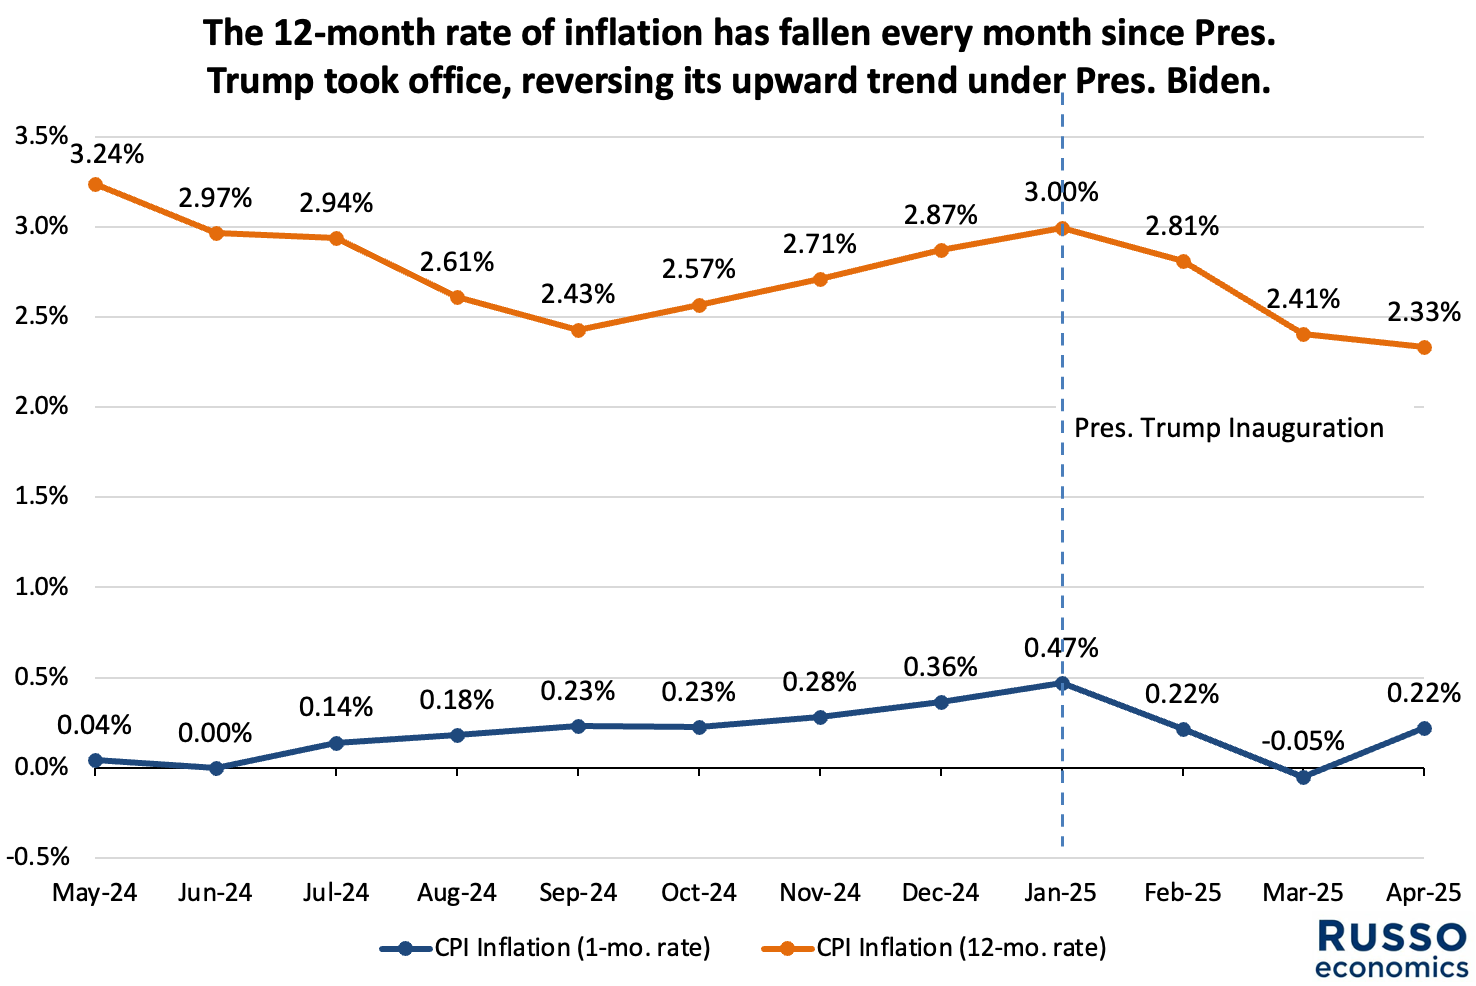
The 12-month rate of inflation (2.3%) fell for the third month in a row.
Inflation was lower this month than almost all of the Biden admin.
(Charts) Inflation During the First 100 Days — Biden vs. Trump
The stock market rallies, boosting American retirement savings.
The House Reconciliation Bill — The Good, the Bad, and the Ugly
Bottom Line: The House’s Fiscal Math Does Not Add Up
Bill will accelerate the debt spiral by raising primary deficits by 0.9% of GDP.
Fiscal hawks should say “no” and send W&M back to the drawing board.
Email chris@russoecon.com with questions, suggestions, or to request a briefing or testimony. Feel free to forward or subscribe (it’s free). Thanks for your support!
Best,
Chris
Key Takeaways from Today’s Consumer Price Index (CPI) Report
At 8:30am ET, the BLS announced that CPI inflation was modest in April.
Headline CPI inflation: 0.22% m/m (matching the Clev. Fed nowcast of 0.22%)1
Core CPI inflation: 0.24% m/m (close to the Clev. Fed nowcast of 0.23%)2
As a result of these monthly increases:
Headline CPI inflation: 2.33% y/y (down from 2.41% last month)
Core CPI inflation: 2.78% y/y (down from 2.81% last month)
In a related report, the BLS announced that wages roughly kept pace with prices.
Real average hourly earnings: 0% m/m (1.4% y/y)
Real average weekly earnings: -0.1% m/m (1.7% y/y)
Suggested Messaging
This is a great day for messaging.
This is the lowest 12-month inflation rate since Feb 2021, meaning that inflation was lower this month than all but two months during Pres. Biden’s term.
Inflation began spiking in April 2021 after Pres. Biden and Democrats passed a deficit-financed $1.9 trillion stimulus package without justification.
The recession had been over for a year by this point. There was no economic justification for sending checks to voters, making UI more generous, etc.
Under Pres. Trump and Republican majorities in the House and Senate, wages are growing faster than prices. Many workers are better off today than 100 days ago.
(Charts) Inflation During the First 100 Days — Biden vs. Trump
Feel free to use/remix for the floor or social media. Please credit “RussoEconomics.”


The Stock Market Rallies, Bolstering American Retirement Savings
Yesterday, U.S. stocks rallied on news of a prospective U.S.-China trade deal.
Expected stock market volatility fell to the lowest level since “Liberation Day.”
Since mid-January, 30-year primary mortgage rates are down by about 0.3%.
The House Reconciliation Bill — The Good, the Bad, and the Ugly
This week, the House Ways and Means, Energy and Commerce, and Agriculture Committees released highly-anticipated details about the House reconciliation bill.
Markups will occur at 2:00pm ET (E&C), 2:30pm ET (W&M), and 7:30pm ET (Ag).
The Good
Plaudits to Chairman Guthrie and Republicans on the Energy and Commerce Committee who saved “more than $880 billion,” above their $880 billion floor.
Special mention: Chairman Guthrie walked a difficult tightrope by finding smart savings from Medicaid while keeping moderate Republicans on board.
For Medicaid, the bill adds work requirements for most able-bodied adults (18hrs/wk of work, school, or volunteering); imposes cost sharing through most copays for specialist visits; roles back a Biden-era limit on eligibility checks; freezes the “provider taxes” scheme; requires immigrant recipients show proof of citizenship; reduces payments to states providing illegal aliens with healthcare coverage; and stops funding for orgs that perform abortions.
Unleashing the American wireless spectrum through FCC spectrum auctions and unleashing American energy through permitting are also smart moves.
Plaudits to Chairman Walberg and Republicans on the Education and Workforce Committee. They saved $351 billion, exceeding the $350 billion floor, primarily from improving federal student loan programs.
Plaudits to Chairman Comer and Republicans on the Oversight Committee. They saved $51.6 billion, exceeding the $50 billion floor, primarily from improving and modernizing federal civil service retirement benefits.
Plaudits to Chairman Green and Republicans on the Homeland Security Committee. They spent $67.1 billion on border security, below the $90 billion cap.
Special mention: Chairman Green showed off serious fiscal discipline and conservative principles by spending significantly less than the cap allowed.
Plaudits to Chairman Westerman and Republicans on the Natural Resources Committee. They saved $18.6 billion, exceeding the $1 billion floor, primarily through unleashing American energy through oil and gas leasing.
Special mention: By dollar amount, HNRC saved the most above its floor.
Plaudits to Chairman Hill and Republicans on the Financial Services Committee. They saved $5.2 billion, exceeding the $1 billion floor, mostly from capping the amount the CFPB can take the from Fed profits.
Special mention: As a percentage, HFSC saved the most above its floor.
Plaudits to Chairman Jordan and Republicans on the House Judiciary Committee for increasing deficits “by less than $110 billion,” which was their cap.
The Bad
While I do not oppose smart increases to military spending, the House Armed Services Committee spent $144 billion, which far exceeds the $100 billion cap.
This overspend eats up almost all of the hard-won savings described above.
While its increased funding for Air Traffic Control is much needed, the House Transportation Committee saved $8 billion, falling short of the $10 billion floor.
While its SNAP reform is desirable, the House Ag Committee bill lacks a score, which prevents me from substantively evaluating it.3
House E&C left a lot of potential Medicaid savings on the table. E.g., it did not eliminate “provider taxes,” and it essentially enshrines the Obamacare expansion.
The Ugly
While the bill lacks a CBO score, the House Ways and Means Committee bill spends an estimated $4,920 billion, which far exceeds their $4,500 billion cap.4
The cost is inflated by a host of no-growth, base-narrowing policies. E.g.,
No tax on tips
No tax on overtime
Deductibility of interest on car loans
SALT deduction cap of $30,000 (up from $10,000)
A “senior deduction” of $4,000 (stand-in for no tax on Social Security)
“MAGA accounts” (a rebranded idea from Sen. Booker and The Squad)
The bill includes minimal savings, in the grand scheme of things.
The bulk of savings has to come from W&M. It is where all the money is!
The bill doesn’t even claw back all of the IRA green energy subsidies.
The $4.5 trillion cap should not be a goal to hit, but a fiscal disaster to avoid.
Netting all of this, the House is over its Cmte-level caps by roughly $465 billion, whereas the Cmtes were suppose to find additional savings of $498 billion.
Overall, the bill is about $963 billion over weight vs. reconciliation instructions.5
Bottom Line: The House’s Fiscal Math Does Not Add Up
Republicans have spent the last decade campaigning against deficit-financed spending. Over four years, we saw a Democratic trifecta turn into a Republican trifecta because reckless spending pushed inflation to a four-decade high. Voters hated inflation, and Republicans promised to restore fiscal sanity and price stability.
In 2023, the Joint Economic Committee laid out a mathematical framework for U.S. debt stabilization. While the path is perilous, there is a window for Congress to act. Members need to lower the primary deficit and raise long-run economic growth.
This bill does the opposite. It will blow out the primary deficit by 3.5 trillion over 10 years, or about 0.9% of GDP.6 The pro-growth provisions of the bill will not increase economic growth by anywhere near the 0.9% per year needed to offset this deficit hike.
The result would be an acceleration of the debt spiral, likely causing higher inflation. To the extent higher debt does not cause higher inflation, it will crowd out business investment and R&D, dragging down capital formation, productivity, and growth.
As Chairman Schweikert says, “You can’t outrun the math.” Well, the math is about to eat us alive. Fiscal hawks should say “no” and send W&M back to the drawing board. Remove the no-growth pork, and find big savings from limiting tax expenditures.
Preview of Upcoming Data Releases
May 29, 8:30am ET. The BEA will release the “second” estimate of Q1 real GDP.
Watch for revisions to real GDP growth (-0.3%) driven by inventories and imports.
Watch for an estimate of “gross domestic income” (a sanity check on GDP).
May 30, 8:30am ET. The BEA will release personal income and consumption for April.
This will include PCE inflation, which is the Fed’s preferred inflation measure.
The Clev. Fed model projects that inflation was modest (0.19% m/m, 2.23% y/y).
Stuff to Read While Waiting for Votes
Editorial Board, WSJ: The Incredible Shrinking GOP Tax Cut
Editorial Board, WSJ: Hollywood Doesn’t Need a Tax Subsidy
Sen. Johnson, WSJ: The Ugly Truth About the ‘Big Beautiful Bill’
Amelia Kuntzman, EPIC: Setting the Record Straight on Food Stamp Savings
Samuel Bray, Divided Argument: The Arguments Against Universal Injunctions
m/m = month-over-month. y/y = year-over-year. Data in this section are seasonally adjusted.
“Core” inflation excludes the volatile food and energy categories. It gives a quick rule of thumb for where inflation may be headed over the medium term. Of course, food and energy prices are important, and are included in the Fed’s 2% annual inflation target.
The Ag Cmte is instructed to save at least $230 billion. It claims savings of $290 billion from changes to SNAP, but also includes reconciliation-permissible provisions from the failed 2024 Farm Bill. This will count against SNAP savings. Since the 2024 Farm Bill was scored at as hiking the 10-year deficit by $33 billion, I assume that Ag has accomplished its goal.
This number is based on JCT’s analysis of the partial bill released by W&M a few days ago. The actual deficit impact might be higher because the partial bill excluded many of these no-growth, base-narrowing policies. It is hard to analyze further without an actual score.
(Edit: JCT has released a score of the W&M bill. See “Important Update” at the top.)
This number is rough because we do not have scores for several of the Committees’ bills. If Ag and E&C manage to find significant excess savings, this might be closer to $900 billion. However, it could be near or above $1 trillion if the full W&M bill further exceeds its cap.
(Edit: JCT has released a score of the W&M bill. See “Important Update” at the top.)
10-year primary deficit calculated by netting the estimated saving/spending of each Cmte. Expressed as a percent of GDP using the CBO’s Jan 2025 projections for the next 10 FYs.